Counting the Aisle: Turning Repeat Store Visits into Defensible Category Evidence
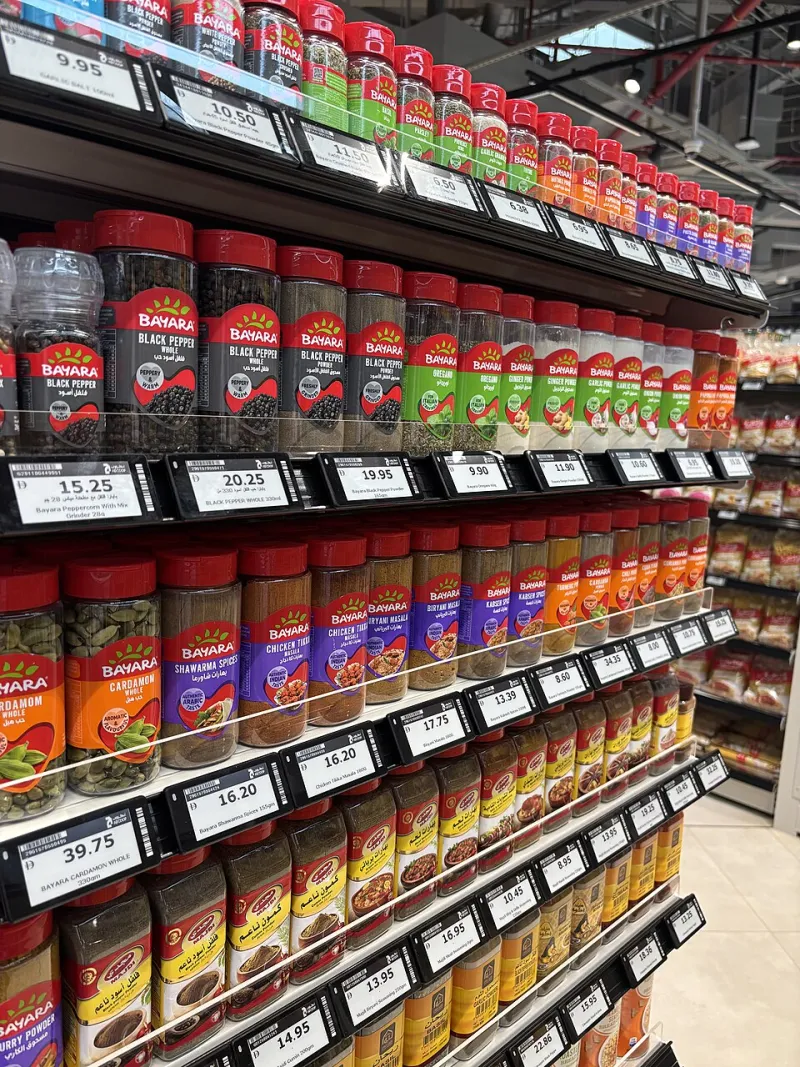
Photo: Maheshod98, CC BY 4.0, via Wikimedia Commons
Most UK category teams already visit stores. Far fewer can produce, six months later, a defensible account of what they saw, where, when and how often. The difference between those two positions is not budget. It is protocol.
A store check, done properly, is a structured observation exercise: a fixed template applied by calibrated observers to a defined sample of outlets, repeated on a known cadence, with a record that a sceptical finance director could interrogate. Done badly, it is a phone full of shelf photographs and a strong feeling about a competitor's pricing.
Begin with the decision, not the template
The template should be built backwards from the question the board will actually ask. Useful category questions tend to be narrow: is our share of facings in convenience declining in the South East; is the £2.50 price-marked pack being undercut in discounters; which of our three core SKUs is most often out of stock in Tesco Express formats.
Write that question down before designing a single field. Every column on the template then has to earn its place by helping answer it. Templates that try to capture everything — footfall, staff friendliness, ambient temperature, competitor gondola ends — tend to be completed inconsistently and analysed never.
The anatomy of a usable record
A practical template for a UK grocery or high-street category check typically carries four blocks of fields.
Location identity. Store identifier, fascia, format (large supermarket, convenience, discounter, forecourt, pharmacy, specialist), trading location type (high street, retail park, neighbourhood parade), region, and a visit timestamp to the hour.
Product observation. GTIN or internal SKU code, pack size, shelf-edge price, any promotional mechanic (multi-buy, temporary price reduction, meal deal inclusion), unit price where calculable, shelf level, facings count, and adjacent brands.
Availability. Present, absent, or present but out of stock, with a separate flag for a gap on the shelf where a label exists. That last distinction matters: an empty facing with a live price ticket is a different commercial event from a delisted line.
Evidence. Three photograph types per observed section — a wide shot establishing the fixture, a mid shot of the shelf run, and a close-up of the price ticket. Timestamped, geo-tagged where policy allows, and named to a convention that matches the store identifier.
Resist the temptation to record opinion alongside observation. 'Competitor blocking looks aggressive' is not a data point; 'competitor holds 11 of 18 facings at eye level' is.
Calibrating the observer
Two observers counting the same shelf will not, left alone, produce the same number. Facings are ambiguous at the edges, shelf levels are arguable, and promotional flags are easy to miss.
Run a calibration session before the first wave. Send two observers to the same three stores independently, compare their records field by field, and resolve the disagreements in a written glossary. Repeat the exercise at the start of each subsequent wave, because drift is gradual and unnoticed.
Set a tolerance. If facings counts between observers differ by more than roughly one in ten, the definition needs sharpening rather than the observers needing retraining.
Sampling outlets you can defend
The purpose of sampling is not to produce a market share figure — a store check cannot do that. It is to produce a repeatable read on a defined population of outlets.
A stratified design is usually sufficient: stratify by fascia, then by format, then by region, with a quota for urban and rural locations and, where relevant, a spread across indices of multiple deprivation. Store size proxies — floor area bands, or simply the number of tills — help keep like with like.
State the design in the report. 'Sixty stores across four fascias and six regions, visited in the second week of each quarter' is a sentence a board can weigh. 'A range of stores nationally' is not.
Rotate a proportion of the panel each wave to avoid observers becoming familiar enough with a store to stop noticing it, but retain a core of constant stores so that trend comparisons remain valid.
Cadence and comparability
Repeat the exercise in the same weeks each period. UK promotional cycles, school holidays and the run-up to Christmas all distort shelf conditions, and a wave that drifts from March to May is not comparable with the one before it. Record bank holidays, local events and any known retailer resets so that anomalies can be explained rather than buried.
Turning observation into a board metric
Four measures travel well into a board pack: facings share within a defined fixture, availability rate as a percentage of observed stores, price index against a fixed basket of comparator lines, and planogram or agreed-distribution compliance.
Each needs its denominator stated. Availability of 94 per cent across 58 stores is a different claim from availability of 94 per cent across 400. Where a measure rests on a small number of observations, say so rather than letting a thin base masquerade as a trend.
Where the method stops
A store check tells you what is on the shelf. It does not tell you why a shopper walked past it, whether the retailer's depot held stock, or what happened online. It is a complement to EPOS, panel and retailer data, not a substitute — and it is most valuable precisely where those sources are thin, such as independents, forecourts and specialist retail.
Ethics and etiquette matter too. Observe from public areas, avoid photographing staff or customers, follow each retailer's policy on in-store photography, and be prepared to leave if asked. Keep records in line with UK data protection requirements and agree a retention period for images before the first visit.
A closing discipline
Version-control the template, log every change with a date and a reason, and store the raw records alongside the analysis. The point of the exercise is not the photograph you remember taking. It is the record someone else can audit in eighteen months and reach the same conclusion.